
Best Indicators for Quotex Trading: A Beginner Guide
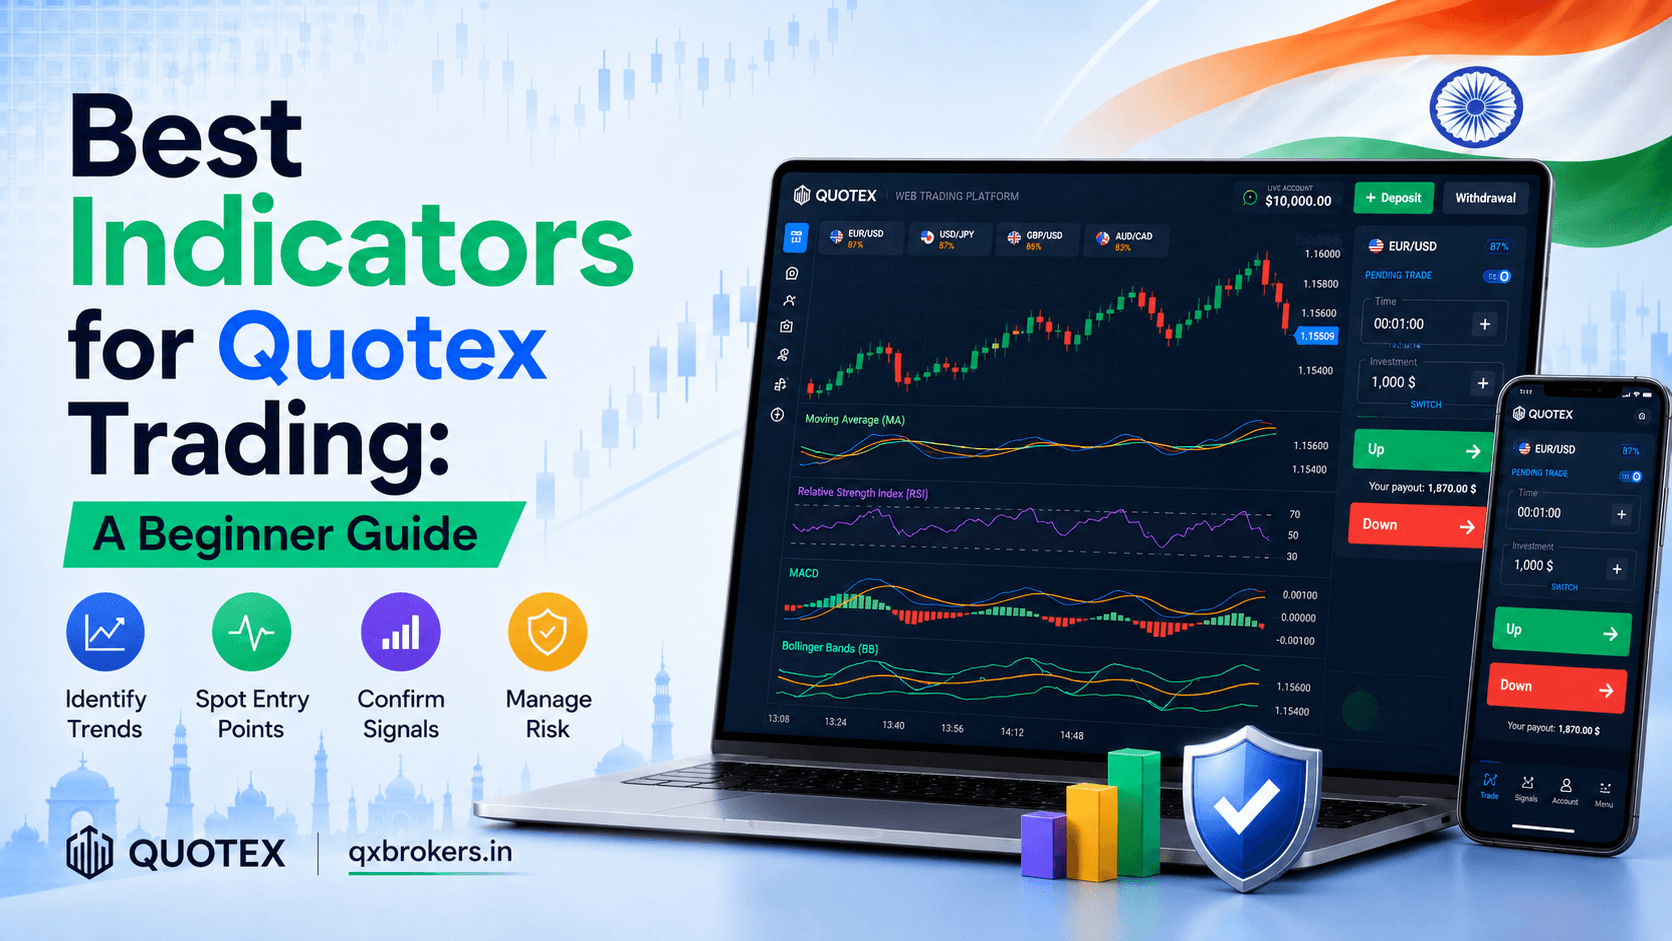
Best Indicators for Quotex Trading can help traders understand price direction, momentum, and volatility on Quotex. However, no indicator can predict what the market will do next. Instead, indicators analyse current and historical price data to provide insights that help traders make more structured and informed trading decisions.
The best indicators for Quotex trading include the Moving Average, Relative Strength Index, MACD, Bollinger Bands and Average Directional Index. These tools can help traders identify market trends, overbought or oversold conditions, changes in momentum and periods of higher volatility. Traders should also understand the best time to trade on Quotex because indicator performance can vary depending on market sessions, trading volume and volatility. Quotex encourages users to test indicators and trading timings through its demo account before using real funds.
Table of Contents
- Which Indicator Is Best for Quotex?
- What Are Quotex Trading Indicators?
- Moving Average
- Relative Strength Index
- Moving Average Convergence Divergence
- Bollinger Bands
- Average Directional Index
- Best Indicator Combination for Quotex Beginners
- Best Quotex Indicators for a Trending Market
- Best Quotex Indicators for a Sideways Market
- Common Indicator Mistakes to Avoid
- How to Test Quotex Indicators Safely
- Final Verdict
- FAQs
Which Indicator Is Best for Quotex?
There is no single indicator that works best in every market condition.
- RSI is useful for checking momentum and overbought or oversold conditions.
- Moving Average helps identify the general market direction.
- MACD can confirm momentum and possible trend changes.
- Bollinger Bands help measure volatility and identify price expansion.
- ADX measures the strength of a market trend.
- Support and resistance can provide price context for indicator signals.
For beginners, a simple combination of a Moving Average and RSI may be easier to understand. Traders can use the Moving Average to identify direction and RSI to check momentum. More indicators do not automatically produce more accurate signals.
What Are Quotex Trading Indicators?
Trading indicators are mathematical tools that study information such as price movement, time, momentum and volatility. They display their calculations on or below the price chart.
Indicators do not guarantee that the next trade will be profitable. Their purpose is to help traders interpret the current market instead of making decisions only through emotions or guesses.
Quotex provides access to trading indicators and a demo account where users can test different tools and decide which ones suit their trading style. The platform itself recommends testing indicators in a practice environment.
Moving Average
A Moving Average is one of the easiest indicators for Quotex beginners. It calculates the average price of an asset over a selected number of candles.
The indicator appears as a line on the price chart. It smooths out small price movements and makes the broader market direction easier to see.
How to read a Moving Average
When the price remains above the Moving Average, the market may have an upward bias. When the price remains below it, the market may have a downward bias.
A trader can also observe the direction of the Moving Average itself:
- A rising line can indicate an upward trend.
- A falling line can indicate a downward trend.
- A flat line can suggest a sideways market.
The official QxBroker educational blog describes the Moving Average as a tool for understanding the overall market direction and recognising possible support or resistance areas.
Suggested beginner settings
Beginners can test:
- 20-period Simple Moving Average
- 50-period Simple Moving Average
- 20-period Exponential Moving Average
An Exponential Moving Average gives greater importance to recent prices, so it normally reacts faster than a Simple Moving Average. A faster reaction can be useful, but it can also create more noise on very short charts.
Best use of the Moving Average
The Moving Average is generally more useful in a trending market. It may produce confusing signals when the market repeatedly moves sideways.
Traders should avoid entering a trade only because the price briefly touches or crosses the Moving Average. Candle structure, support and resistance, momentum and market conditions should also be checked.
Relative Strength Index
The Relative Strength Index, commonly known as RSI, is a momentum indicator. It moves between 0 and 100 and measures the speed and strength of recent price changes.
Traditional RSI levels are:
- Above 70: potentially overbought
- Below 30: potentially oversold
- Near 50: neutral momentum
The standard RSI calculation commonly uses 14 periods. RSI is often more useful in a range-bound market, while strong trends can keep it overbought or oversold for an extended period.
How to use RSI on Quotex
Suppose RSI falls below 30. This does not automatically mean the trader should select an upward trade. It means selling momentum has been strong and the market may be approaching an oversold condition.
Before considering a decision, traders can look for additional confirmation, such as:
- Price reaching an established support level
- A bullish rejection candle
- RSI moving back above 30
- A change in short-term price structure
The same principle applies when RSI moves above 70. A trader should wait for evidence that buying pressure is weakening instead of immediately predicting a downward movement.
RSI divergence
Divergence occurs when the price and RSI move in different directions.
For example, the price may create a higher high while RSI creates a lower high. This can suggest that upward momentum is becoming weaker. Divergence is a warning, not a guaranteed reversal signal.
Best RSI settings for beginners
A 14-period RSI with levels at 30 and 70 is a practical starting point. Traders should test any alternative setting on a demo account before applying it to real-money trading.
Moving Average Convergence Divergence
Moving Average Convergence Divergence, or MACD, is used to study trend direction and momentum.
The standard MACD setup usually includes:
- A 12-period Exponential Moving Average
- A 26-period Exponential Moving Average
- A 9-period signal line
- A histogram showing the difference between the lines
When the MACD line moves above the signal line, momentum may be turning bullish. When it moves below the signal line, momentum may be turning bearish. However, MACD is a lagging indicator and can generate false signals, especially in sideways markets.
How to use MACD on Quotex
A MACD crossover becomes more meaningful when it agrees with the broader price direction.
For example:
- The price is above a rising Moving Average.
- The market creates higher highs and higher lows.
- The MACD line crosses above its signal line.
- The histogram starts expanding above zero.
This combination can provide stronger momentum confirmation than a MACD crossover viewed alone.
When MACD may not work well
MACD can produce repeated crossovers when the market has no clear direction. Traders should first determine whether the asset is trending or consolidating.
Using MACD together with support, resistance or ADX may help filter low-quality signals.
Bollinger Bands
Bollinger Bands are used to measure price volatility. The indicator normally contains three lines:
- A 20-period Moving Average in the middle
- An upper band
- A lower band
The upper and lower bands are generally positioned two standard deviations away from the middle Moving Average. The bands expand when volatility increases and contract when volatility decreases.
How to read Bollinger Bands
When the bands become narrow, the market is experiencing lower volatility. This condition is known as a Bollinger Band squeeze.
A squeeze may appear before a stronger market movement, but it does not identify the direction of that movement. Traders still need price-action confirmation.
When the bands widen, volatility is increasing. This can happen after a breakout, during a news event or when market participation rises.
Does touching a band create a signal?
A price touching the upper band is not automatically a sell signal. A price touching the lower band is not automatically a buy signal.
During a strong trend, the price can continue moving along one band for several candles. Traders should check the trend, candle behaviour and nearby support or resistance before interpreting a band touch as a reversal.
RSI and Bollinger Bands combination
RSI and Bollinger Bands are often used together because they measure different market conditions.
A possible bullish setup may include:
- Price reaches a recognised support area.
- Price touches or moves outside the lower Bollinger Band.
- RSI reaches an oversold area.
- A bullish rejection candle appears.
- Price closes back inside the bands.
A bearish setup would use the opposite conditions near resistance. Traders should test this setup extensively because no combination removes the risk of false signals. The Quotex educational blog also discusses using RSI, Bollinger Bands and candlestick confirmation together rather than treating one signal as sufficient.
Average Directional Index
The Average Directional Index, known as ADX, measures trend strength. It does not directly tell traders whether the market is moving upward or downward.
Common ADX interpretations include:
- Below 20: weak or unclear trend
- Above 25: stronger trend conditions
- Higher readings: increasing trend strength
The official QxBroker indicator guide describes ADX as a tool for evaluating trend strength, with readings above 25 commonly associated with stronger trends.
How ADX can improve indicator selection
ADX can help traders decide which type of strategy may suit the current market.
When ADX is high and rising, trend-following tools such as Moving Averages or MACD may be more useful.
When ADX is low, the market may be moving sideways. In that environment, RSI combined with clear support and resistance may provide more useful context.
ADX should not be treated as a complete strategy. It is mainly a filter that helps traders understand the current market environment.
Best Indicator Combination for Quotex Beginners
A beginner does not need five indicators on one chart. Too many tools can create conflicting information and make decisions more difficult.
A simple combination is:
20 EMA and RSI
Use the 20-period Exponential Moving Average to study direction and RSI to study momentum.
For an upward market condition:
- The price remains above the 20 EMA.
- The EMA is moving upward.
- The price returns toward the EMA or support.
- RSI remains above 40 or recovers from a lower level.
- A bullish confirmation candle appears.
For a downward market condition:
- The price remains below the 20 EMA.
- The EMA is moving downward.
- The price returns toward the EMA or resistance.
- RSI remains below 60 or turns lower.
- A bearish confirmation candle appears.
These conditions are educational examples, not guaranteed trading signals.
Best Quotex Indicators for a Trending Market
When the market is clearly trending, traders may consider:
- Moving Average for direction
- MACD for momentum confirmation
- ADX for trend strength
- Support and resistance for entry context
A Moving Average and MACD both depend on price data, so they can provide similar information. Traders should avoid believing that two similar indicators create independent confirmation.
Best Quotex Indicators for a Sideways Market
When the market is moving between clear support and resistance levels, traders may consider:
- RSI
- Bollinger Bands
- Horizontal support and resistance
- Candlestick confirmation
RSI can remain overbought or oversold during a strong trend, so traders should first confirm that the market is genuinely moving inside a range.
Common Indicator Mistakes to Avoid
Using too many indicators
Adding multiple indicators can create a crowded chart and conflicting signals. One indicator for direction and one for confirmation is often easier to manage.
Trading every crossover
Not every Moving Average or MACD crossover represents a meaningful change. Crossovers happen frequently in sideways markets.
Treating overbought as an immediate sell signal
An overbought RSI reading means upward momentum has been strong. It does not guarantee that the price will immediately fall.
Ignoring support and resistance
Indicators become more useful when their signals appear near an important price area.
Changing settings after every loss
Constantly changing indicator periods can lead to over-optimisation. Traders may create settings that look successful on previous charts but fail under new market conditions.
Using indicators during major news without caution
Economic announcements can cause rapid price changes, increased volatility and unpredictable execution. Historical indicators may react too slowly during such events.
Believing in guaranteed accuracy
No indicator or strategy provides a guaranteed win rate. Quotex’s official risk disclosure states that financial market transactions can result in losses and that market instability, technical problems and changing conditions create additional risks.
How to Test Quotex Indicators Safely
Before using real funds, traders can create written rules for their setup and test those rules on a demo account.
Record the following information:
- Asset
- Market session
- Chart timeframe
- Indicator settings
- Market direction
- Entry reason
- Trade result
- Mistake or lesson
A small sample of successful trades is not enough to prove that a strategy works. Test the setup under trending, sideways and volatile market conditions.
Quotex provides a demo balance for practice and specifically presents its demo environment as a way to test trading tools and strategies.
Final Verdict
The best indicators for Quotex trading depend on the condition of the market.
Moving Averages can help identify direction. RSI can measure momentum. MACD can confirm trend changes. Bollinger Bands can show changes in volatility. ADX can determine whether a trend is strong or weak.
For beginners, combining a Moving Average with RSI and basic support and resistance may be easier than using several complicated tools. The main goal should be to understand what each indicator measures, wait for confirmation and test every strategy on a demo account.
Indicators should support a trading decision, not make the entire decision. Traders should also consider market structure, volatility, economic news, timing and risk management.
Trading Forex and other financial instruments involves significant risk and can result in the loss of invested capital. Quotex advises users not to invest more than they can afford to lose and to confirm whether the service is permitted under the laws of their country.
FAQs
What is the most accurate indicator for Quotex?
There is no indicator that is always accurate. RSI, Moving Averages, MACD, Bollinger Bands and ADX provide different types of information. Their usefulness depends on the market condition, selected asset, timeframe and trading rules.
Which Quotex indicator is best for beginners?
A Moving Average and RSI are commonly easier for beginners to understand. The Moving Average shows general direction, while RSI provides information about momentum.
What is the best RSI setting for Quotex?
The standard 14-period RSI with levels at 30 and 70 is a practical starting point. Traders should test alternative settings on a demo account instead of assuming that a shorter setting will be more accurate.
Can I use RSI and MACD together?
Yes, but both study momentum in different ways. RSI may help identify strong or weak momentum, while MACD may help confirm the direction of a trend. They should still be combined with price structure and support or resistance.
Is Bollinger Bands good for Quotex trading?
Bollinger Bands can help traders understand volatility, price expansion and consolidation. A band touch should not be treated as an automatic reversal signal.
How many indicators should I use on Quotex?
One primary indicator and one confirmation tool may be enough for many beginners. Using too many indicators can create confusion and duplicate the same market information.
Can indicators guarantee profit on Quotex?
No. Indicators are calculations based on price information. They can produce false or delayed signals, and no indicator can guarantee profitable results.
Should beginners test indicators on a demo account?
Yes. Demo practice allows beginners to understand indicator behaviour and create rules without immediately risking real funds. However, demo results do not guarantee the same outcome in live trading.